|
Menu: |
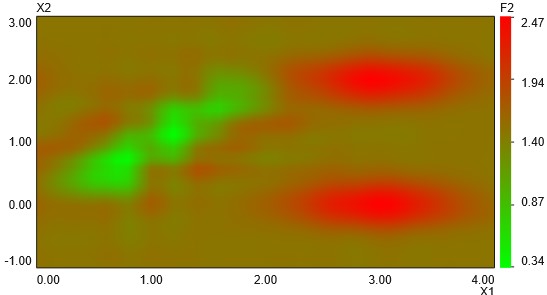
Analysis / Response Surface / 2D Surface |
It is possible to show dependence of criteria or constraints on 2 parameters as 2D surface.
User is asked first for selection of the x-,y-, z-, and color-axis:
x- and y-axis can be only stochastic design parameter
color-axis can be criterion or constraint
After selection the axis, the 3D surface plot will be shown. Left mouse click on the 3D surface plot to edit its options in the property windows:
Surface: show the surface of the response
Contou : show the contour of the surface
Contour Number: the total number of contours
Support Points: show the support points of the response surface
Color: color for the point
Radius: radius of the point
Min Color: color for the max. value
Max Color: color for the min. value
Decimal Place: show decimal place for the number
E-Format: show E-format for the number
Gridpoints: number of grid points of the response surface for each axis
Auto-Scale: If Auto-Scale is set to True, the min. and max. values of the axis will be calculated automatically. If it is set to False, user can define these values manually.