|
Menu: |
Analysis / Design of Experiment / BoxPlot |
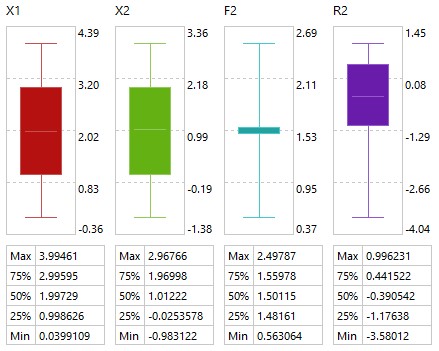
First, user will be asked for selection of parameters, criteria and constraints. than the boxplot of the selected elements will be shown. It presents the statistics of the data as min. and max. value as well as 25% and 75% probability of the distribution.and its bandwidth.
Left mouse clicking on the graphics to edit the options of the boxplot in the property windows:
Color: color of the boxplot
Legend: show or hide the legend
Show Number: show or hide the number of the axis
Decimal Place: decimal place of the number
E-Format: E-format of the number.
Auto-Scale: the min. and max. value of the axis can be set manually.