|
Menu: |
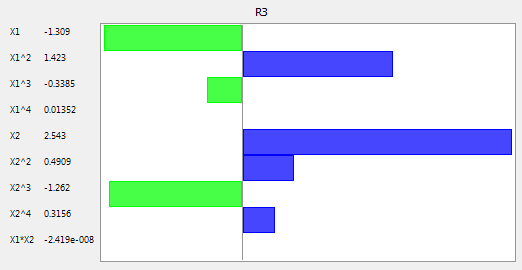
Analysis / Response Surface / Coefficient Chart |
An empty window will be open. Use drag & drop to insert a element of the experiment as criteria or constraints from the explorer into the opened window. The polynomial coefficients of the approximated meta model are shown as bars and its values on the left side. If the meta model has no polynomial part, the chart will be blank.