|
Menu: |
Analysis / Design of Experiment / Correlation Matrix |
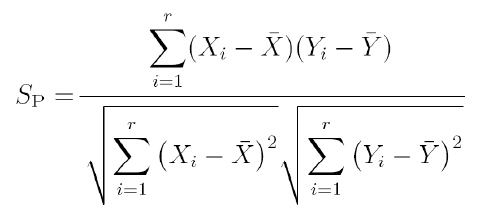
It shows the Spearman linear correlation between stochastic design parameters and constraints as well as criteria on the upper triangular matrix:
Correlation coefficient is located in range of -1 and +1 and its value is displayed in the matrix as scaled color element:
The correlation coefficient means only the linear dependence between design parameters. It does not mean the global nonlinear relationships on the design space.
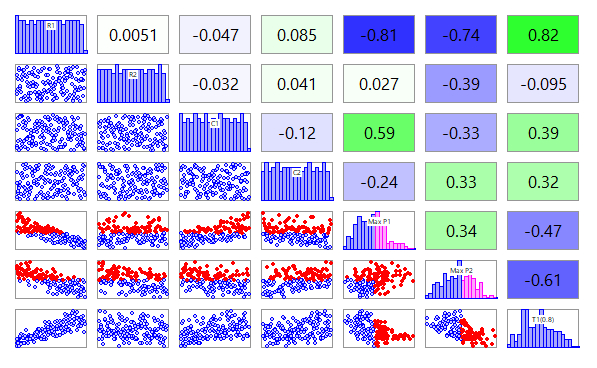
On the diagonal are the histograms with the name of the parameter. On the lower triangular matrix are the corresponding scatter plots. The relationship between the correlation coefficient and the scatter plot can be explained:
Click the left mouse on the scatter plot or coefficient plot, the corresponding elements of the matrix will be highlighted as red.
Using menu "File /Data Export" to export the correlation coefficients to data file.