|
Menu: |
Analysis / Probabilistics / Probability Density |
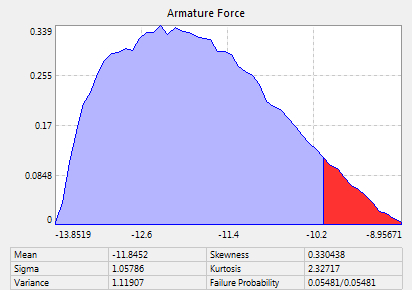
An empty window will be open. Use drag & drop to insert a element of the experiment as stochastic parameter, criteria or constraints from the explorer into the opened window. Its probability density function (pdf) will be shown. Additional statistical data as minimum, maximum, mean value, sigma, variance, skewness and kurtosis are also displayed bottom. If the element is a constraint, the partial failure probability will be listed and the violated ranges are shown in red.
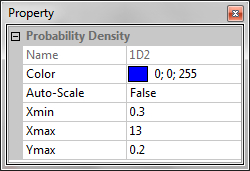 Left mouse click on the pdf plot
to edit its options in the property
windows:
Left mouse click on the pdf plot
to edit its options in the property
windows:
Color: the color of the displayed pdf can be changed
Auto-Scale: If Auto-Scale is set to True, the min. and max. values of the X- and Y-axis will be calculated automatically fitting to the windows. If it is set to False, user can define these values manually.