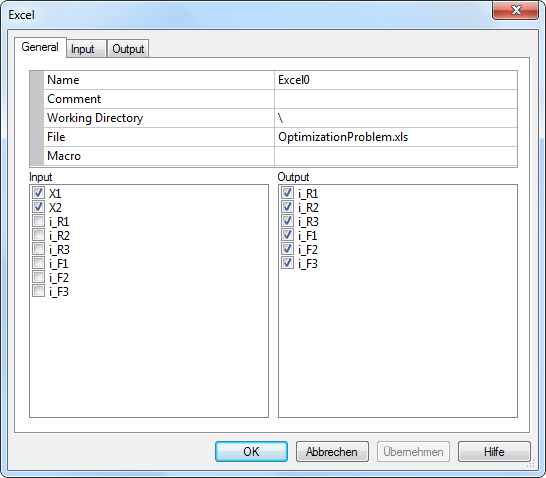
The node "Excel" realizes calling a table of MS Excel. The COM-interface to MS Excel is implemented internally. Double-click on its symbol in the workflow editor to open the property window:
General
Name
It is the name of the node Excel. This name may be defined basically once time for the entire experiment.
Comment
The comment for the element Excel .
Working Directory
It is the working directory for the Excel file be opened. If the directory starts with the sign "\", it will be the relative path located on the directory of its OptiY-File (*.opy).
File
First select the field and press the button on the right side to open an existing MS Excel file. The name and the path of the Excel file will appear on the corresponding windows. MS Excel will start at the background automatically.
Macro
It is the name of macro in the Excel table, which will be performed at each step of simulation or optimization process.
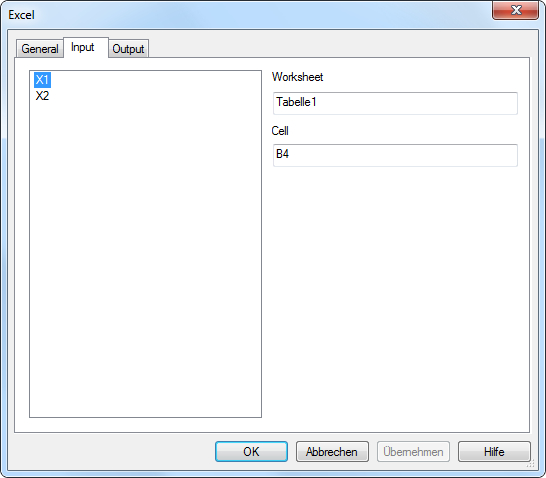
Input
The inserted elements as nominal and stochastic parameters, transfer and output variables of the experiment can be selected as input links of the Excel file. The data of selected elements will be transferred into the Excel table.
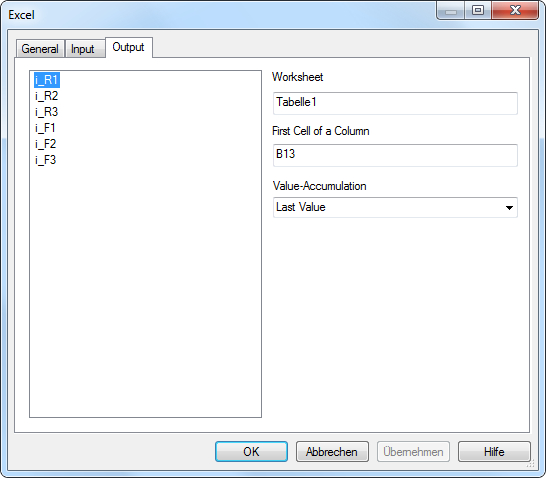
Output
The inserted output variables of the experiment can be selected as output links for the Excel table. After each simulation, the data of the assigned cells in the Excel table will be transferred into these output variables.
Input
The cells of the Excel table can be now assigned to the selected input links, which are listed in the left window. First select a input link (e.g. X1), then edit the names of worksheet (e.g. Tabelle1) and cell (e.g. B4) of the Excel file in the corresponding windows. So the cell on the worksheet of the Excel file will be assigned to the selected input link. If the input link contains a value array (e.g. output variables of OptiY), all values will be put on the excel column after the cell.
Output
The selected output links listed on the left side can be assigned to the cells of the Excel table. First select a output link (e.g. i_R1), then put the names of worksheet (e.g. Tabelle1) and the first cell of a column (e.g. B4) of the Excel file in the corresponding windows. So all data of the column beginning with the cell on the worksheet of the Excel file will be read and assigned to the selected output.
Value-Accumulation
After all links are assigned to model results, the accumulation of result values of model can be edited. That is to arrange how the values of the output links can be calculated from the values list of the simulation results. There are several possibilities as Last Value, Minimal Value, Maximal Value, Mean Value, Sum, Absolute Sum, Bandwidth and Standard Deviation.