|
Menu: |
Analysis / Design of Experiment / Histogram |
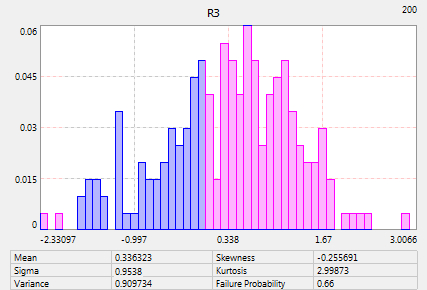
An empty window will be open. Use drag & drop to insert a element of the experiment as stochastic parameter, output variable or transfer variables etc. from the explorer into the opened window. The collected data of the element inserted will be displayed as histograms. This is a distribution density form of a discrete simulation. X-axis is divided normally in 50 bars. Y-axis is the frequency of collected data. Further statistical data as minimum, maximum, mean value, sigma, variance, skewness and kurtosis are also shown bottom. If the element is a constraint, the partial failure probability will be listed and the violated ranges are shown in red.
Left mouse clicking on the histogram to edit the options of the histogram in the property windows:
Density as Y-Axis: If the option is True, the Y-Axis is density (CDF). otherwise, it is the sample number inside of the bar.
Color: the color of the displayed bars can be changed
Number of Bars: the number of the displayed bars can be changed
Auto-Scale: If Auto-Scale is set to True, the min. and max. values of the X- and Y-axis will be calculated automatically fitting to the windows. If it is set to False, user can define these values manually.