|
Menu: |
Analysis / Probabilistics / Interaction Chart |
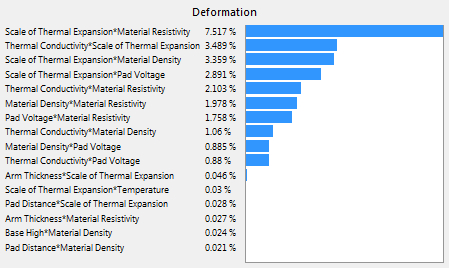
An empty window will be open. Use drag & drop to insert a element of the experiment as criteria or constraints from the explorer into the opened window. A Pareto chart of the interaction sensitivities generated for the inserted element related to all stochastic design parameters. The interaction sensitivities of the inserted element are shown as ranked bars. The values are given in percentage on the left side.
Left mouse click on the interaction chart to edit its options in the property windows:
Color: the color of the displayed bars can be changed
Global Interaction Chart
For all constraints and criteria f1, f2, f3, ..., fn and ist weighting factors w1, w2, w3, ..., wn of an experiment. The global function results from the weighted sum of all constraints and criteria:
f = w1*f1 + w2*f2 + w3*f3 + ... + wn*fn
The global interaction chart shows the interaction of all experiment parameters related to this global function f.