Residual Plot
|
Menu: |
Analysis / Response Surface / Residual Plot |
An empty window will be
open. Use drag & drop to insert a element of the
experiment as criteria or constraints from the explorer into the opened window.
The residuals are shown as bars for the all points calculated by the original
model. These points are called support points and they are the basics for the
building of the meta-model. Residual is the absolute difference between original
model calculation and the calculation by the meta-model. It represents the
quality of the approximation at the support points. The smaller the residuals,
the better and more realistic is the meta-model.
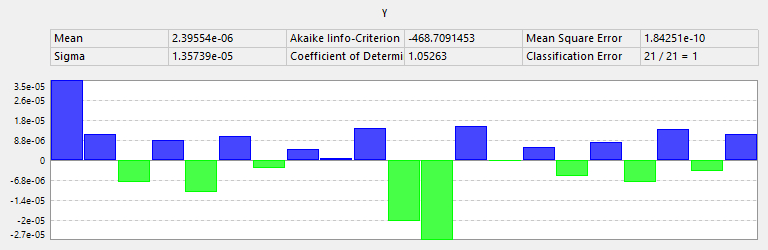
On the plot, there are also other statistic values as mean value (M), standard deviation (S), mean square error (MSE), classification error (CE), adjusted coefficient of determination (aCoD) and Akaike information criterion (AIC) with degree of freedom in bracket. The classification error (CE) is the quotient of number of non-zero-residuals to the number of all residuals. The formulas for these statistic values are following:
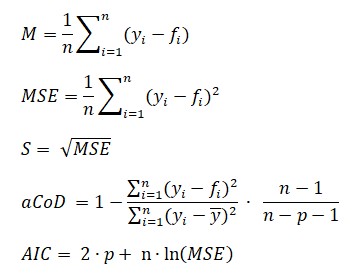
· y - observed data from original model or measurement
· f - predicted data from meta-model
· n - number of data points
· p - number of parameters or degree of freedom
Left mouse click on the residual plot to edit
its options in the property windows:
·
Data: user
can choose different support points as training and test or measurement data
for the residual plot