|
Menu: |
Analysis / Select Set |
The optimization process generates a lot of solution points in the experiment. By this menu, different set of the optimization results is available to select and to show graphically. For the decision, user has to select one best design point. The mathematical decision making support is possible, but sometimes it is not the best one to satisfy all requirements of the design process. It is helpful to select a subset of all results to show them graphically for a manually decision making. There are 3 possible selection options of the optimization results:
Optimization
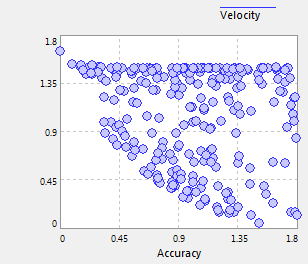
This option is normally set as standard option. The opened nominal tables and diagrams show all result steps of the optimization process. Each point represents one optimization step. It contains the Pareto optimal solutions as well as non-optimal solution points. The picture below shows the results of a multi-objective optimization with 2 defined criteria (Velocity and Accuracy) as "2D-Diagram":
Pareto Frontier
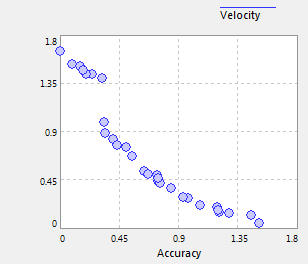
The option makes only Pareto optimal points available. The nominal tables and diagrams show only these results points:
Filtered Pareto Frontier
Only some filtered points of the Pareto optimal solutions are selected and available. The selected points are equidistant to each other. They scatter uniformly in the design space. This small subset of the Pareto solution points is very helpful to improve the decision process.
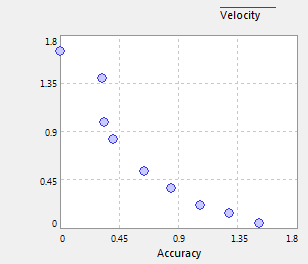
The number of Pareto solution points filtered is normally set to 10. It is changeable by clicking the left mouse button on the diagram, the option "Pareto Number" is shown in the property window for editing.