|
Menu: |
Analysis / 1D Variable/ Scatter Plot |
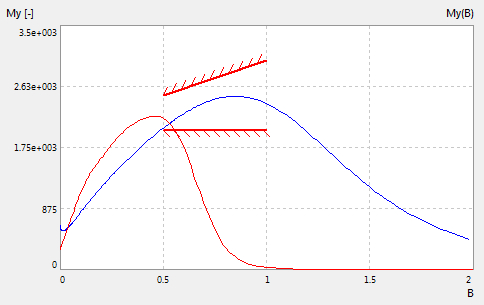
An empty window will be opened. Using a drag & drop to move the element 1D-Variable from the explorer to the opened window. The dynamical signal of the selected 1D-variable with X-and Y-axis will be shown. By moving the left mouse while holding it pressed, the signal window can be zoomed. With the right mouse click on the window, the automatically scaling with the min and max values of the signal is activated.
Options:
Click the left mouse on the window, the options of the 1D-signal can be edited in the property windows:
| Line Color : | change the color of the signal |
| Constraints : | show or hide the constraints in the signal window |
| Data : | show or hide the signal of the imported data in the signal window |
| X-Scale : | change the scaling of the X-axis (Linear, Logarithm, Inverse) |
| Y-Scale : | change the scaling of the Y-axis (Linear, Logarithm, Inverse) |
| Auto-Scale : |
False = axis boundaries are set
manually True = axis boundaries are set automatically to its max and min value |