|
Menu: |
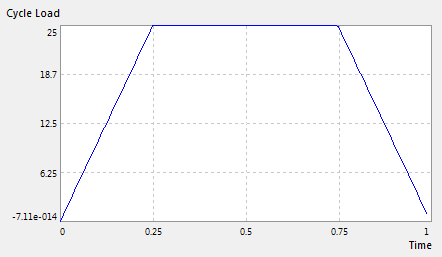
Analysis / Fatigue Life Prediction / Load Diagram |
An empty window will be open. Using a drag & drop operation put the element "stochastic design parameter" from the explorer to the opened window. If the load function is designed by this stochastic design parameter, its load signal for a cycle will be displayed. Other case, it will show only the empty diagram frame. The X-axis is the cycle time defined by Fatigue Life Prediction Settings. By moving the left mouse holding pressed, user can zoom the signal window. With the right mouse click on the diagram, the automatically scaling with its min and max values of the signal will be activated.
Options of the diagram
 Click the left mouse button on the
diagram to edit its options in the property windows:
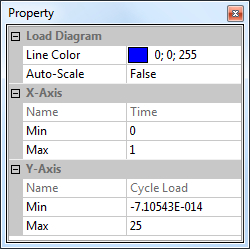
Click the left mouse button on the
diagram to edit its options in the property windows:
| Line Color : | the color of the signal |
| Auto-Scale : |
False = axis boundaries are set
manually True = axis boundaries are set automatically to its max and min value |