|
Menu: |
Analysis / 1D Variable/ Residual Plot |
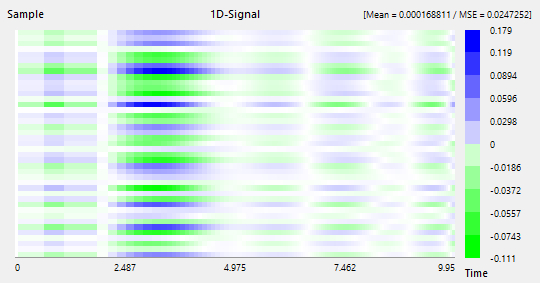
An empty window will be opened. Using a drag & drop to move the element 1D-variable from the explorer to the opened window. The residual of the dynamical signal of the selected 1D-variable with X-and Y-axis will be shown. By moving the left mouse while holding it pressed, the signal window can be zoomed. With the right mouse click on the window, the automatically scaling with the min and max values of the signal is activated. The X-axis is the X-axis of the 1D-variable. The Y-axis is the sample number of design of experiment.
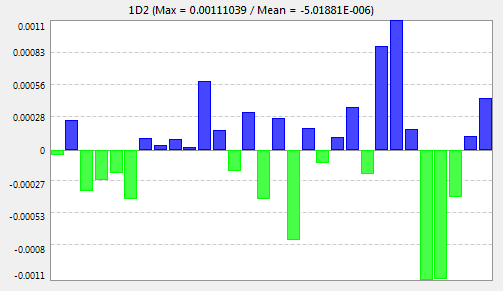
Use the menu "Analysis / Response Surface / Residual Plot" to open an empty windows and use Drag & Drop to move the item 1D-variable in the explorer into the open windows to show the residual plot of the 1D-variable at the X-Value of the X-Axis. The Y-axis is the value of the residual and the X-axis is the sample number. The animation process for this grafical windows can be started using the menu "Analysis / 1D Variable / Start Animation". The X-Value of the 1D-Variable will be incremented and the grafical windows will be updated.