|
Menu: |
Analysis / 1D Variable/ Scatter Plot |
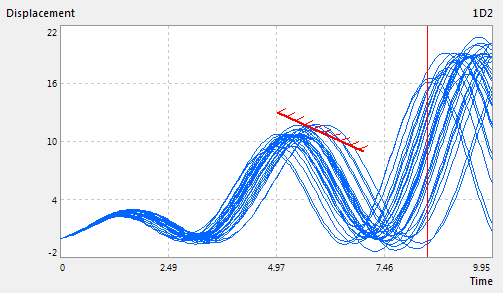
An empty window will be opened. Using a drag & drop to move the element 1D-variable from the explorer to the opened window. The DOE scatter of the dynamical signal of the selected 1D-variable with X-and Y-axis will be shown. By moving the left mouse while holding it pressed, the signal window can be zoomed. With the right mouse click on the window, the automatically scaling with the min and max values of the signal is activated.
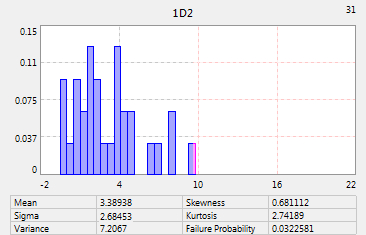
If the option "X-Value" =True, the red line is displayed in the plot. It shows the position of the X-value in the X-axis for the 1D signal. While pressing the left mouse button on the red line, user can move the mouse position to move the red line position. Use the menu "Analysis / Design of Experiment / Histogram" to open an empty windows and use Drag & Drop to move the item 1D-variable in the explorer into the open windows to show the histogram of the 1D-variable at the X-Value of the X-Axis. The Y-axis of the histogram is the frequency and the X-axis of the histogram is the Y-axis of the 1D signal scatter. If there is any constraint for the 1D signal, the failure probability for this histogram at the X-value and the total failure probability will be shown. The animation process for this grafical windows can be started using the menu "Analysis / 1D Variable / Start Animation". The X-Value of the 1D-Variable will be incremented and the grafical windows will be updated.
Options:
Click the left mouse on the window, the options of the 1D-signal scatter can be edited in the property windows:
| Type : | show the signal type as classification or clustering |
| Z-Axis : | select the criteria or constraints for classification or clustering |
| Color : | show the color of the signal |
| Highlight Color : | change the highlight color of the signal |
| Decimal Place : | show decimal place for the number |
| E-Format : | show e-format for the number |
| X-Value: | show or hide the red line for the virtual X-value in the X-axis |
| Constraints : | show or hide the constraints in the signal window |
| Data : | show or hide the signal of the imported data in the signal window |
| Show every data point : | show every signal of data [0, 1]. 1 = show all signals of data, 0 = show no signal of data |
| X-Scale : | show the scaling of the X-axis (Linear, Logarithm, Inverse) |
| Y-Scale : | show the scaling of the Y-axis (Linear, Logarithm, Inverse) |
| Auto-Scale : |
False = axis boundaries are set
manually True = axis boundaries are set automatically to its max and min value |
Data-Export:
If the view is activated by clicking the left mouse button on the windows, all data of 1D-variable can be exported to file using the menu "File / Data Export"