|
Menu: |
Analysis / Nominal Optimization / Nominal Diagram |
Using a drag & drop operation put the elements from the explorer to the main window or to a empty window opened by the above menu, elements as Nominal, Stochastic, Output Variables, Transfer Variables, Switcher, Constraints and Criteria can be inserted and shown dependent on the optimization steps. Constraints are displayed with 2 lines as upper and lower boundaries. During the optimization process, these elements are displayed as graphical curves with its min. and max. values. User can monitor the process und stop it if necessary. Select a signal by a double-click with the left mouse button on the name of the signal. The area of the name will be highlighted with a red rectangle. The line color and style of the selected signal can be changed in the property window. Non-desired elements can be selected and deleted with Del-key. By moving the left mouse holding pressed, user can zoom the signal window. With the right mouse click on the window, the automatically scaling with the min and max values of the signal is activated.
Diagrams of signals
There are different types to display the signal for an optimization process. Surface-, line-, point- Diagram and its recombination are available. Just click the left mouse button on the signal window. These options are shown in the property window for editing:
| Frame : | show the frame of the signal diagram |
| Node : | show signal as point |
| Line : | show signal as line |
| Decimal Place : | decimal place of the number |
| E-Format : | e-format of the number |
| Auto-Scale : | axis boundaries are set manually or automatic |
2D-Diagram
Diagrams for the signals are normally displayed as curves depending on the optimization step. This is a type of "Y(n)-Diagram". It is also possible to display all signals depending on another signal as "2D-Diagram". First select a signal by clicking with the left mouse button on the signal name area, whose rectangle is bordered in red line. Then activate the menu: "Analysis/ Diagram/ 2D-Diagram". All inserted signals will be shown depending on the selected signal as 2D-diagram. The 2D-diagrams are very useful for a multi-objective optimization to display criteria depending on other criteria. Activate the menu: "Analysis/ Diagram/ Y(n)-Diagram" to reset the display options.
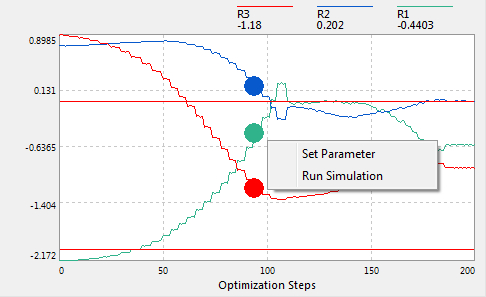
Select Solution
It is not possible to select automatically a solution point of a multi-objective optimization task, because there are several Pareto optimal solution points in a optimization set. User is asked to select a best solution from the Pareto set. Before selecting a solution, all signals must be displayed as point-diagrams (Node= True). Then double-click with the left mouse on a solution point to be selected. The selected solution point is displayed with a big circle. Then activate the context menu by clicking the right mouse button. Here, user can set parameters or run simulation on the solution point.