|
Menu: |
Analysis / Response Surface / 1D Diagram |
An empty window will be open. Use drag & drop to insert elements of the experiment as stochastic design parameters, criteria or constraints from the explorer into the opened window. The 1D diagram of the meta model for the elements will be displayed.
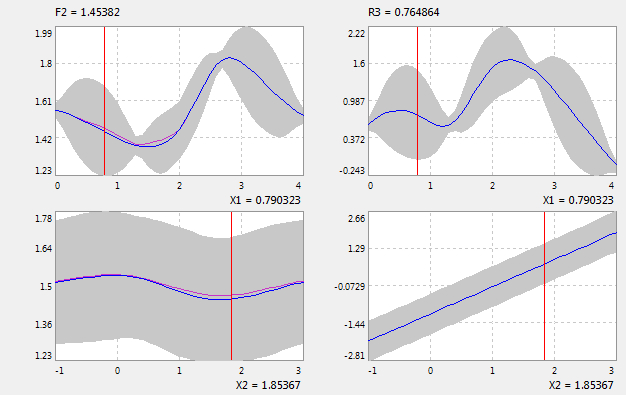
The blue line is the meta model. The gray bar show the confidence interval of 95% for the meta model. The red line displays the virtual nominal value of the stochastic design parameters, which can be edit to show virtual values of criteria or constraints without restart the simulation for the original model. To move the red line, press the left mouse button on the red line and move the mouse while pressing the button. An other way to change the real value of the stochastic variables is clicking on the name with the left mouse button. The window area for the meta-model can be zoomed by the left mouse click and keeping pressing while moving. by left mouse double-click, the initial state of the metta-model will be reset.
Left mouse click on the section diagram to edit its options in the property windows:
Color: show the color for the line.
Decimal Place: show the decimal place for the number
E-Format: show e-format for the number
Gridpoints: number of grid points for the response surface.
Fine Scaling: show the fine scaling for the axis .
Actual Value: show the red line for the actual value
Support Points: show the support points of the response surface. User can specify the supports points from data of Training, Test or Measurement.
Confidence Interval: show the confidence interval for the meta model .
Latent Function: show the latent function for the classification.
Auto-Scale: If Auto-Scale is set to Loccal, the min. and max. values of the axis will be calculated automatically for each parameter. By the option=Global, the Min and Max forY-Axis of all windows will be the same. Thus, user can visually compare the meta-model related to all parameters with each other. If it is set to Custimized, user can define these values manually for individual windows..
Click the right mouse on a diagram to show a context menu for working with the meta model.