|
Menu: |
Analysis / 1D Variable/ Response Surface |
An empty window will be opened. Using a drag & drop to move the element 1D-variable from the explorer to the opened window. The response surface of the dynamical signal of the selected 1D-variable with X-and Y-axis will be shown. By moving the left mouse while holding it pressed, the signal window can be zoomed. With the right mouse click on the window, the automatically scaling with the min and max values of the signal is activated. Click the right mouse button on the diagram again to show the context menu
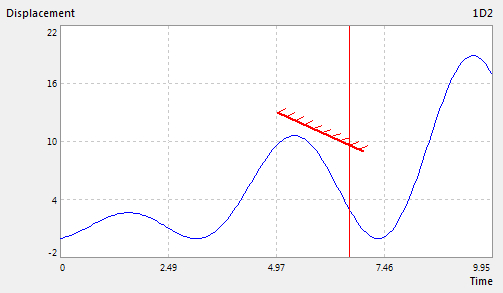
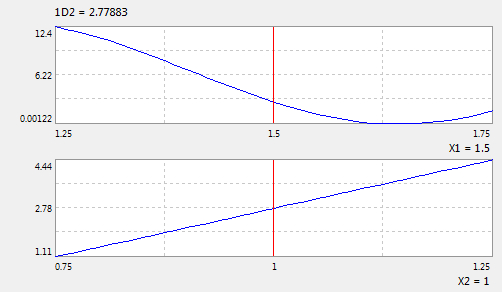
If the option "X-Value" =True, the red line is displayed in the plot. It shows the position of the X-value in the X-axis for the 1D signal. While pressing the left mouse button on the red line, user can move the mouse position to move the red line position. Use the menu "Analysis / Response Surface / Section Diagram" to open an empty windows and use Drag & Drop to move the item 1D-variable as well as the stochastic parameters in the explorer into the open windows to show the section diagram of the 1D-variable at the X-Value of the X-Axis. The animation process for this grafical windows can be started using the menu "Analysis / 1D Variable / Start Animation". The X-Value of the 1D-Variable will be incremented and the grafical windows will be updated.
Options:
Click the left mouse on the window, the options of the 1D-signal response surface can be edited in the property windows:
| Color : | show color of the signal |
| Decimal Place : | show decimal place for the number |
| E-Format : | show e-format for the number |
| X-Value: | show red line for the virtual X-value in the X-axis |
| X-Step : | step size for the x-axis to calculating the response surface |
| Constraints : | show constraints |
| Data : | show signal of the imported data |
| Show Select Index : | show the selected signal of DOE-data |
| Select Index Color : | color for the selected signal |
| Select Index : | index of the selected signal |
| X-Scale : | show scaling of the X-axis (Linear, Logarithm, Inverse) |
| Y-Scale : | show scaling of the Y-axis (Linear, Logarithm, Inverse) |
| Auto-Scale : |
False = axis boundaries are set
manually True = axis boundaries are set automatically to its max and min value |